;}.cls-2{fill:%2358d687;}.cls-3{fill:url(%23Degradado_sin_nombre_10);}.cls-4{fill:url(%23Degradado_sin_nombre_31);}.cls-5{fill:%238030d1;}.cls-6{fill:url(%23Degradado_sin_nombre_23);}%3c/style%3e%3clinearGradient%20id='Degradado_sin_nombre_17'%20x1='129.39'%20y1='83.35'%20x2='56.4'%20y2='162.54'%20gradientUnits='userSpaceOnUse'%3e%3cstop%20offset='0'%20stop-color='%23287d8c'/%3e%3cstop%20offset='1'%20stop-color='%2350b5db'/%3e%3c/linearGradient%3e%3clinearGradient%20id='Degradado_sin_nombre_10'%20x1='449.01'%20y1='190.97'%20x2='266.02'%20y2='78.2'%20gradientUnits='userSpaceOnUse'%3e%3cstop%20offset='0'%20stop-color='%23ffe286'/%3e%3cstop%20offset='1'%20stop-color='%23ffcd1d'/%3e%3c/linearGradient%3e%3clinearGradient%20id='Degradado_sin_nombre_31'%20x1='99.7'%20y1='309.69'%20x2='146.19'%20y2='485.35'%20gradientUnits='userSpaceOnUse'%3e%3cstop%20offset='0.01'%20stop-color='%23ff9464'/%3e%3cstop%20offset='1'%20stop-color='%23b3553a'/%3e%3c/linearGradient%3e%3clinearGradient%20id='Degradado_sin_nombre_23'%20x1='547.05'%20y1='208.96'%20x2='252.56'%20y2='438.86'%20gradientUnits='userSpaceOnUse'%3e%3cstop%20offset='0'%20stop-color='%23ff7da1'/%3e%3cstop%20offset='1'%20stop-color='%23f20b4f'/%3e%3c/linearGradient%3e%3c/defs%3e%3ctitle%3efavicon%3c/title%3e%3cg%20id='_Group_'%20data-name='<Group>'%3e%3cg%20id='_Group_2'%20data-name='<Group>'%3e%3cg%20id='_Group_3'%20data-name='<Group>'%3e%3cpath%20id='_Path_'%20data-name='<Path>'%20class='cls-1'%20d='M232.54,165.43a124.47,124.47,0,0,1-106.95,60.76h0A101.77,101.77,0,0,1,23.82,124.41V0L132.31,95.94A517.46,517.46,0,0,0,232.54,165.43Z'/%3e%3cpath%20id='_Path_2'%20data-name='<Path>'%20class='cls-2'%20d='M250,0V101.78a123.87,123.87,0,0,1-17.46,63.65A517.46,517.46,0,0,1,132.31,95.94L23.82,0Z'/%3e%3cpath%20id='_Path_3'%20data-name='<Path>'%20class='cls-3'%20d='M476.18,226.19a518.87,518.87,0,0,1-243.64-60.76A123.87,123.87,0,0,0,250,101.78V0A226.12,226.12,0,0,1,476.18,226.19Z'/%3e%3cpath%20id='_Path_4'%20data-name='<Path>'%20class='cls-4'%20d='M232.54,334.57a517.71,517.71,0,0,0-100.23,69.54L23.82,500V375.59A101.77,101.77,0,0,1,125.59,273.81h0A124.47,124.47,0,0,1,232.54,334.57Z'/%3e%3cpath%20id='_Path_5'%20data-name='<Path>'%20class='cls-5'%20d='M250,398.22V500H23.82l108.49-95.89a517.71,517.71,0,0,1,100.23-69.54A123.87,123.87,0,0,1,250,398.22Z'/%3e%3cpath%20id='_Path_6'%20data-name='<Path>'%20class='cls-6'%20d='M476.18,273.81A226.12,226.12,0,0,1,250,500V398.22a123.87,123.87,0,0,0-17.46-63.65A518.87,518.87,0,0,1,476.18,273.81Z'/%3e%3c/g%3e%3c/g%3e%3c/g%3e%3c/svg%3e)
 Length 3:47
12 Dashboard design tips for better data visualization
About this video
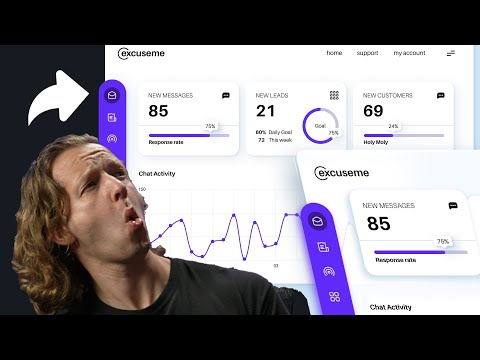
A walkthrough of twelve tips for designing dashboards, covering purpose, which content to include, data-ink ratio, number rounding, choosing efficient visualizations, grouping and consistency, hierarchy, context, clear labels and designing for people. The lessons are presented as applicable to any dashboard tool.
What you’ll learn
- Choose the most efficient visualization for each dashboard metric
- Apply hierarchy, consistency and clear labels across a dashboard layout
- Cut clutter by keeping only the most important data and rounding numbers