;}.cls-2{fill:%2358d687;}.cls-3{fill:url(%23Degradado_sin_nombre_10);}.cls-4{fill:url(%23Degradado_sin_nombre_31);}.cls-5{fill:%238030d1;}.cls-6{fill:url(%23Degradado_sin_nombre_23);}%3c/style%3e%3clinearGradient%20id='Degradado_sin_nombre_17'%20x1='129.39'%20y1='83.35'%20x2='56.4'%20y2='162.54'%20gradientUnits='userSpaceOnUse'%3e%3cstop%20offset='0'%20stop-color='%23287d8c'/%3e%3cstop%20offset='1'%20stop-color='%2350b5db'/%3e%3c/linearGradient%3e%3clinearGradient%20id='Degradado_sin_nombre_10'%20x1='449.01'%20y1='190.97'%20x2='266.02'%20y2='78.2'%20gradientUnits='userSpaceOnUse'%3e%3cstop%20offset='0'%20stop-color='%23ffe286'/%3e%3cstop%20offset='1'%20stop-color='%23ffcd1d'/%3e%3c/linearGradient%3e%3clinearGradient%20id='Degradado_sin_nombre_31'%20x1='99.7'%20y1='309.69'%20x2='146.19'%20y2='485.35'%20gradientUnits='userSpaceOnUse'%3e%3cstop%20offset='0.01'%20stop-color='%23ff9464'/%3e%3cstop%20offset='1'%20stop-color='%23b3553a'/%3e%3c/linearGradient%3e%3clinearGradient%20id='Degradado_sin_nombre_23'%20x1='547.05'%20y1='208.96'%20x2='252.56'%20y2='438.86'%20gradientUnits='userSpaceOnUse'%3e%3cstop%20offset='0'%20stop-color='%23ff7da1'/%3e%3cstop%20offset='1'%20stop-color='%23f20b4f'/%3e%3c/linearGradient%3e%3c/defs%3e%3ctitle%3efavicon%3c/title%3e%3cg%20id='_Group_'%20data-name='<Group>'%3e%3cg%20id='_Group_2'%20data-name='<Group>'%3e%3cg%20id='_Group_3'%20data-name='<Group>'%3e%3cpath%20id='_Path_'%20data-name='<Path>'%20class='cls-1'%20d='M232.54,165.43a124.47,124.47,0,0,1-106.95,60.76h0A101.77,101.77,0,0,1,23.82,124.41V0L132.31,95.94A517.46,517.46,0,0,0,232.54,165.43Z'/%3e%3cpath%20id='_Path_2'%20data-name='<Path>'%20class='cls-2'%20d='M250,0V101.78a123.87,123.87,0,0,1-17.46,63.65A517.46,517.46,0,0,1,132.31,95.94L23.82,0Z'/%3e%3cpath%20id='_Path_3'%20data-name='<Path>'%20class='cls-3'%20d='M476.18,226.19a518.87,518.87,0,0,1-243.64-60.76A123.87,123.87,0,0,0,250,101.78V0A226.12,226.12,0,0,1,476.18,226.19Z'/%3e%3cpath%20id='_Path_4'%20data-name='<Path>'%20class='cls-4'%20d='M232.54,334.57a517.71,517.71,0,0,0-100.23,69.54L23.82,500V375.59A101.77,101.77,0,0,1,125.59,273.81h0A124.47,124.47,0,0,1,232.54,334.57Z'/%3e%3cpath%20id='_Path_5'%20data-name='<Path>'%20class='cls-5'%20d='M250,398.22V500H23.82l108.49-95.89a517.71,517.71,0,0,1,100.23-69.54A123.87,123.87,0,0,1,250,398.22Z'/%3e%3cpath%20id='_Path_6'%20data-name='<Path>'%20class='cls-6'%20d='M476.18,273.81A226.12,226.12,0,0,1,250,500V398.22a123.87,123.87,0,0,0-17.46-63.65A518.87,518.87,0,0,1,476.18,273.81Z'/%3e%3c/g%3e%3c/g%3e%3c/g%3e%3c/svg%3e)
 Length 13:15
Every Chart Type Ranked — What to Use and What to Avoid
About this video
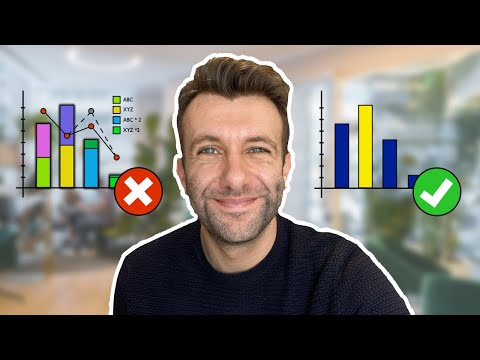
The video surveys the major chart types, from bar and line charts to waterfall, treemap and Sankey diagrams, and explains when each one suits a presentation, report or dashboard. It also covers common chart mistakes to avoid, for presenters and analysts who want their data to tell a clear story.
What you’ll learn
- Choose a chart type that fits a ranking, trend or comparison
- Spot common chart mistakes that blur a message
- Compare bar, line, scatter, waterfall and treemap charts