;}.cls-2{fill:%2358d687;}.cls-3{fill:url(%23Degradado_sin_nombre_10);}.cls-4{fill:url(%23Degradado_sin_nombre_31);}.cls-5{fill:%238030d1;}.cls-6{fill:url(%23Degradado_sin_nombre_23);}%3c/style%3e%3clinearGradient%20id='Degradado_sin_nombre_17'%20x1='129.39'%20y1='83.35'%20x2='56.4'%20y2='162.54'%20gradientUnits='userSpaceOnUse'%3e%3cstop%20offset='0'%20stop-color='%23287d8c'/%3e%3cstop%20offset='1'%20stop-color='%2350b5db'/%3e%3c/linearGradient%3e%3clinearGradient%20id='Degradado_sin_nombre_10'%20x1='449.01'%20y1='190.97'%20x2='266.02'%20y2='78.2'%20gradientUnits='userSpaceOnUse'%3e%3cstop%20offset='0'%20stop-color='%23ffe286'/%3e%3cstop%20offset='1'%20stop-color='%23ffcd1d'/%3e%3c/linearGradient%3e%3clinearGradient%20id='Degradado_sin_nombre_31'%20x1='99.7'%20y1='309.69'%20x2='146.19'%20y2='485.35'%20gradientUnits='userSpaceOnUse'%3e%3cstop%20offset='0.01'%20stop-color='%23ff9464'/%3e%3cstop%20offset='1'%20stop-color='%23b3553a'/%3e%3c/linearGradient%3e%3clinearGradient%20id='Degradado_sin_nombre_23'%20x1='547.05'%20y1='208.96'%20x2='252.56'%20y2='438.86'%20gradientUnits='userSpaceOnUse'%3e%3cstop%20offset='0'%20stop-color='%23ff7da1'/%3e%3cstop%20offset='1'%20stop-color='%23f20b4f'/%3e%3c/linearGradient%3e%3c/defs%3e%3ctitle%3efavicon%3c/title%3e%3cg%20id='_Group_'%20data-name='<Group>'%3e%3cg%20id='_Group_2'%20data-name='<Group>'%3e%3cg%20id='_Group_3'%20data-name='<Group>'%3e%3cpath%20id='_Path_'%20data-name='<Path>'%20class='cls-1'%20d='M232.54,165.43a124.47,124.47,0,0,1-106.95,60.76h0A101.77,101.77,0,0,1,23.82,124.41V0L132.31,95.94A517.46,517.46,0,0,0,232.54,165.43Z'/%3e%3cpath%20id='_Path_2'%20data-name='<Path>'%20class='cls-2'%20d='M250,0V101.78a123.87,123.87,0,0,1-17.46,63.65A517.46,517.46,0,0,1,132.31,95.94L23.82,0Z'/%3e%3cpath%20id='_Path_3'%20data-name='<Path>'%20class='cls-3'%20d='M476.18,226.19a518.87,518.87,0,0,1-243.64-60.76A123.87,123.87,0,0,0,250,101.78V0A226.12,226.12,0,0,1,476.18,226.19Z'/%3e%3cpath%20id='_Path_4'%20data-name='<Path>'%20class='cls-4'%20d='M232.54,334.57a517.71,517.71,0,0,0-100.23,69.54L23.82,500V375.59A101.77,101.77,0,0,1,125.59,273.81h0A124.47,124.47,0,0,1,232.54,334.57Z'/%3e%3cpath%20id='_Path_5'%20data-name='<Path>'%20class='cls-5'%20d='M250,398.22V500H23.82l108.49-95.89a517.71,517.71,0,0,1,100.23-69.54A123.87,123.87,0,0,1,250,398.22Z'/%3e%3cpath%20id='_Path_6'%20data-name='<Path>'%20class='cls-6'%20d='M476.18,273.81A226.12,226.12,0,0,1,250,500V398.22a123.87,123.87,0,0,0-17.46-63.65A518.87,518.87,0,0,1,476.18,273.81Z'/%3e%3c/g%3e%3c/g%3e%3c/g%3e%3c/svg%3e)
 Length 4:33
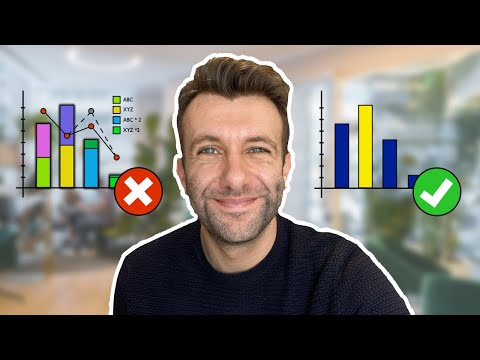
Which Type of Chart or Graph is Right for Your Dashboard or Report Design?
About this video
Explains how to choose a chart type for a dashboard or report by first defining the intent behind the data, such as comparison, trend, composition, distribution or progress. Draws on the Lightning Design System chart guidelines and suits designers new to chart selection.
What you’ll learn
- Match a chart type to the intent behind your data
- Compare trends, composition and distribution in dashboards
- Choose charts that suit your audience's reading habits