;}.cls-2{fill:%2358d687;}.cls-3{fill:url(%23Degradado_sin_nombre_10);}.cls-4{fill:url(%23Degradado_sin_nombre_31);}.cls-5{fill:%238030d1;}.cls-6{fill:url(%23Degradado_sin_nombre_23);}%3c/style%3e%3clinearGradient%20id='Degradado_sin_nombre_17'%20x1='129.39'%20y1='83.35'%20x2='56.4'%20y2='162.54'%20gradientUnits='userSpaceOnUse'%3e%3cstop%20offset='0'%20stop-color='%23287d8c'/%3e%3cstop%20offset='1'%20stop-color='%2350b5db'/%3e%3c/linearGradient%3e%3clinearGradient%20id='Degradado_sin_nombre_10'%20x1='449.01'%20y1='190.97'%20x2='266.02'%20y2='78.2'%20gradientUnits='userSpaceOnUse'%3e%3cstop%20offset='0'%20stop-color='%23ffe286'/%3e%3cstop%20offset='1'%20stop-color='%23ffcd1d'/%3e%3c/linearGradient%3e%3clinearGradient%20id='Degradado_sin_nombre_31'%20x1='99.7'%20y1='309.69'%20x2='146.19'%20y2='485.35'%20gradientUnits='userSpaceOnUse'%3e%3cstop%20offset='0.01'%20stop-color='%23ff9464'/%3e%3cstop%20offset='1'%20stop-color='%23b3553a'/%3e%3c/linearGradient%3e%3clinearGradient%20id='Degradado_sin_nombre_23'%20x1='547.05'%20y1='208.96'%20x2='252.56'%20y2='438.86'%20gradientUnits='userSpaceOnUse'%3e%3cstop%20offset='0'%20stop-color='%23ff7da1'/%3e%3cstop%20offset='1'%20stop-color='%23f20b4f'/%3e%3c/linearGradient%3e%3c/defs%3e%3ctitle%3efavicon%3c/title%3e%3cg%20id='_Group_'%20data-name='<Group>'%3e%3cg%20id='_Group_2'%20data-name='<Group>'%3e%3cg%20id='_Group_3'%20data-name='<Group>'%3e%3cpath%20id='_Path_'%20data-name='<Path>'%20class='cls-1'%20d='M232.54,165.43a124.47,124.47,0,0,1-106.95,60.76h0A101.77,101.77,0,0,1,23.82,124.41V0L132.31,95.94A517.46,517.46,0,0,0,232.54,165.43Z'/%3e%3cpath%20id='_Path_2'%20data-name='<Path>'%20class='cls-2'%20d='M250,0V101.78a123.87,123.87,0,0,1-17.46,63.65A517.46,517.46,0,0,1,132.31,95.94L23.82,0Z'/%3e%3cpath%20id='_Path_3'%20data-name='<Path>'%20class='cls-3'%20d='M476.18,226.19a518.87,518.87,0,0,1-243.64-60.76A123.87,123.87,0,0,0,250,101.78V0A226.12,226.12,0,0,1,476.18,226.19Z'/%3e%3cpath%20id='_Path_4'%20data-name='<Path>'%20class='cls-4'%20d='M232.54,334.57a517.71,517.71,0,0,0-100.23,69.54L23.82,500V375.59A101.77,101.77,0,0,1,125.59,273.81h0A124.47,124.47,0,0,1,232.54,334.57Z'/%3e%3cpath%20id='_Path_5'%20data-name='<Path>'%20class='cls-5'%20d='M250,398.22V500H23.82l108.49-95.89a517.71,517.71,0,0,1,100.23-69.54A123.87,123.87,0,0,1,250,398.22Z'/%3e%3cpath%20id='_Path_6'%20data-name='<Path>'%20class='cls-6'%20d='M476.18,273.81A226.12,226.12,0,0,1,250,500V398.22a123.87,123.87,0,0,0-17.46-63.65A518.87,518.87,0,0,1,476.18,273.81Z'/%3e%3c/g%3e%3c/g%3e%3c/g%3e%3c/svg%3e)
 Length 4:01
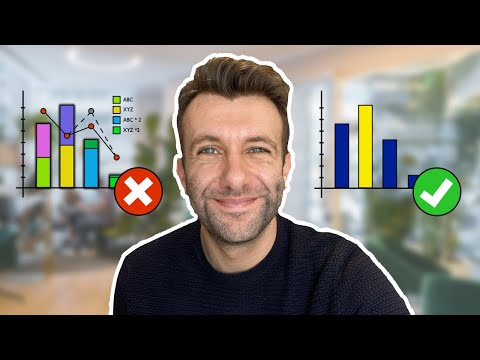
How To Choose The Right Graph (Types of Graphs and When To Use Them)
About this video
This beginner tutorial covers five common chart types, including bar, stacked bar, histogram, pie and line charts, and explains when each suits the data. It is for anyone who needs to choose a clear graph for their data.
What you’ll learn
- Match bar charts to category comparisons and rankings
- Choose stacked bars, histograms or pie charts for part-to-whole and distribution data
- Pick scatter or line charts to show correlation and change over time